These pages will allow you to customize your tag properties, create alarming set points, view tag history and alarm history.
You can navigate to the Tag Details page in any one of the following two ways:
- Click the data value from the grid in the Summary Listing.
- When viewing the Tag Values tab of the Device Details page click on the Tag Description Name.
You will then have several tabs:
Tag History Tab: This will give you an overview of the pas spot polls. You can view this as a graph or see the individual spot poll values.
You can view the historical data for the selected tag in a list by clicking Grid View. You can toggle back to the trend by clicking Chart View (default view).
Keep in mind eLynx will remember which view you have most recently clicked on per session. If you log off and log back in the Chart View will be the view that you see when you navigate to the Tag Details page.
Properties Tab:
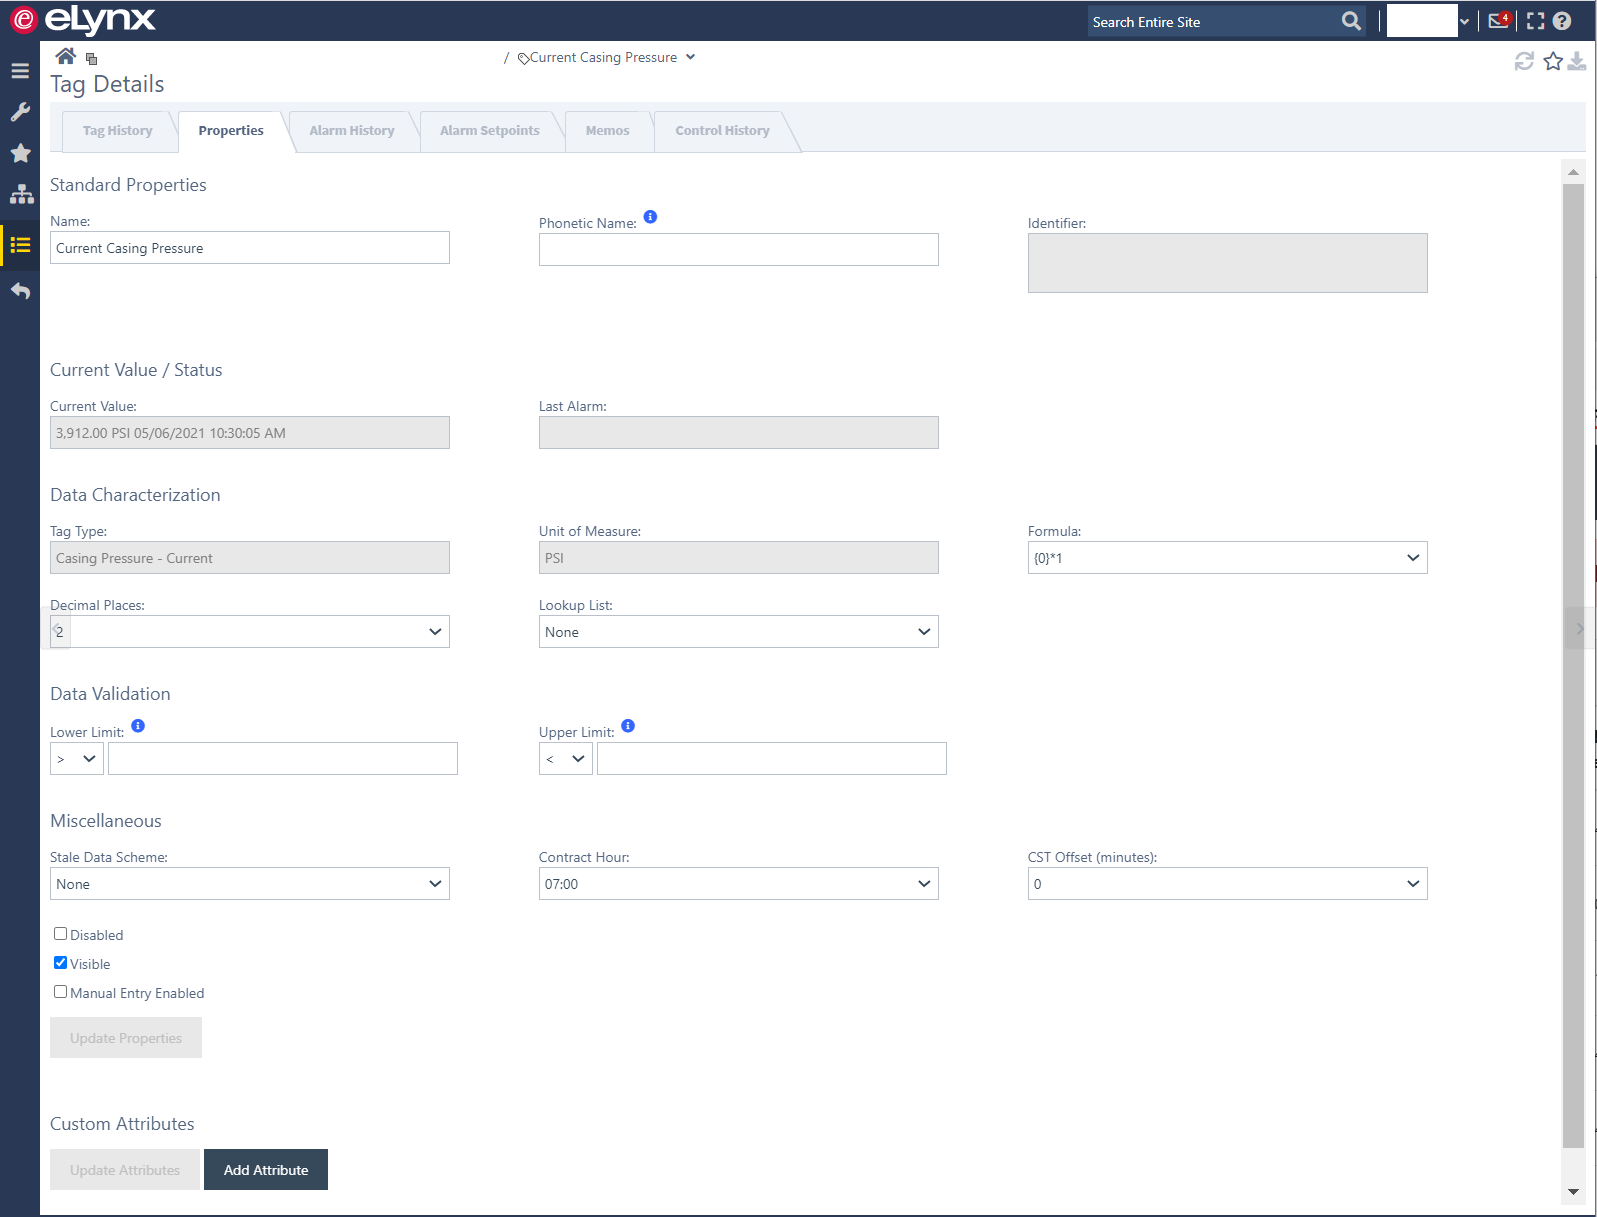
This page allows you to rename a tag, view current value, set data validation filters, change the engineering unit and decimal places, update formulas, update other properties of a tag value, and create attributes for tags.
To update any property information on a tag, enter the appropriate information in the text boxes or use the dropdown menu to select the correct information and click Update.
Note: The necessary permissions must be granted by your administrator to have access to this section.
|
Name |
Name of the Tag Value displayed in SCADALynx. |
|
Identifier |
NOT AN EDITABLE FIELD. |
|
Current Value |
Value at the last poll date and time. |
|
Last Alarm |
If relevant for this device for this tag, the date and time of the last alarm. |
|
Tag Type |
Detailed Tag Name. |
|
Formula |
Convert certain values to how you want it displayed. |
|
Decimal Places |
The number of decimal places you want listed. |
|
List Lookup |
Can apply a look up list already created from this section. |
|
Manual Entry Enabled |
Allows you to manually edit this tag at the tag level. |
|
Contract Hour |
How eLynx recognizes your contract hour. |
|
CST Offset |
Central Standard Time offset. |
Alarm History Tab: Here you can see the history of the alarms for this tag.
Alarm Setpoints Tab: This will show you any alarms set up for the tag. See more information here.
Memos Tab: This will show you any logged changes to the tag.
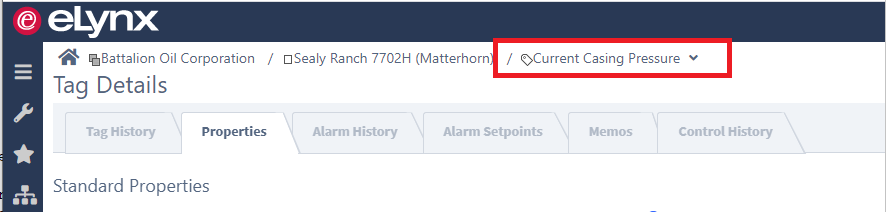
NOTE: You can navigate to the Tag Details page for other tags by clicking the drop-down arrow next to the current tag name at the top of this section and selecting the tag you want to view. You can also click the previous/next arrows shown below.
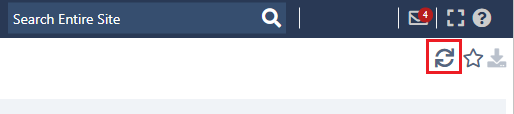
Refresh
The tag history screen will update with the most recent information as the page refreshes and has a new poll from the meter. Click the Refresh icon to update the page. If there has been a poll time since the last refresh the page will display with the most recent polled data value.
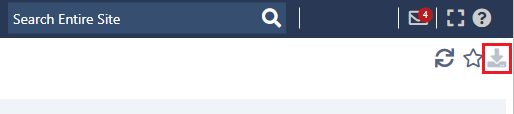
Export
Note: You can export the data into Excel or PDF on either view by clicking the Export icon in the top-right.
Comments
0 comments
Please sign in to leave a comment.