
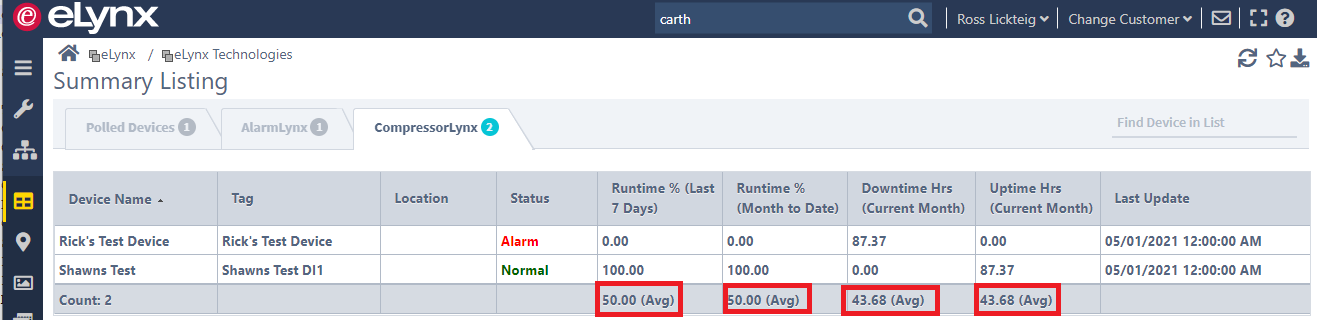
Tag Values are displayed in the 'Totals' row of the Summary Listing and other pages throughout the eLynx website. They are also displayed in the Group Summary view of the Mobile App.
Tag Aggregates are based on the nature of the tag data. For example, daily production values like Daily Gas Flow, Daily Oil Production, and Daily Water Production are typically summed. Pressures, temperatures, and other spot data values are typically averaged. If a customer would prefer a different tag aggregation method (an average instead of a sum, etc.), they will need to email Support to change it.
Comments
0 comments
Please sign in to leave a comment.